

Averaged freshman graduation rates (AFGR) of public secondary schools 
The President's 2020 College Attainment Goal
25- to 34-year-olds who completed an associate's or higher degreeEarly Learning through High School
3- and 4-year-olds enrolled in preschool4th graders Proficient on the NAEP in reading4th graders Proficient on the NAEP in mathematics8th graders Proficient on the NAEP in reading8th graders Proficient on the NAEP in mathematicsFreshmen graduating from high school within 4 yearsPublic school graduates who took at least one Advanced Placement test in high schoolPostsecondary Education and Training
18- to 24-year-olds enrolled in colleges and universitiesStudents completing a bachelor's degree within 6 yearsStudents completing an associate's degree within 3 yearsBachelor's degrees conferred in science, technology, engineering, and mathematicsTeachers and Leaders
School districts using teacher evaluation systemsSchool districts using principal evaluation systemsPublic high school teachers with a major in their main assignment areaAn Excellent Education for All
Difference in current expenditures between high- and low-poverty districts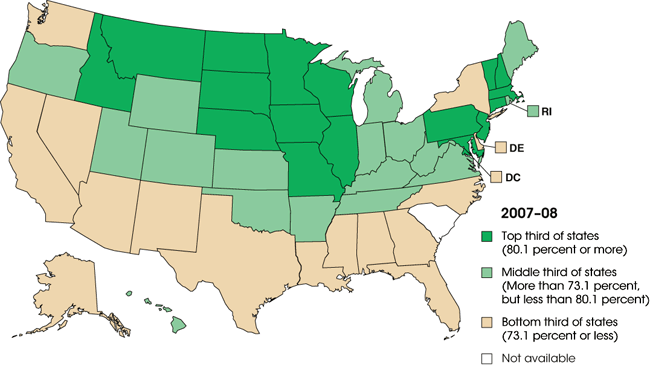
| State | Total | White | Black | Hispanic | Asian/ Pacific Islander |
American Indian/ Alaska Native |
|---|---|---|---|---|---|---|
| Reporting states1 | 74.9 | 81.0 | 61.5 | 63.5 | 91.4 | 64.2 |
| Alabama | 69.0 | 73.9 | 60.6 | 62.2 | 87.3 | 82.3 |
| Alaska | 69.1 | 70.3 | 51.8 | 90.7 | 76.6 | 51.9 |
| Arizona | 70.7 | 73.6 | 76.9 | 66.7 | 98.5 | 56.3 |
| Arkansas | 76.4 | 77.7 | 70.2 | 77.9 | 100.0 | 86.9 |
| California | 71.2 | 80.1 | 57.4 | 61.2 | 91.1 | 65.3 |
| Colorado | 75.4 | 82.9 | 65.1 | 56.7 | 92.1 | 62.0 |
| Connecticut | 82.2 | 87.5 | 71.1 | 65.8 | 99.0 | 65.8 |
| Delaware | 72.1 | — | — | — | — | — |
| District of Columbia | 56.0 | 88.9 | 58.8 | 54.2 | 74.4 | 100.0 |
| Florida | 66.9 | 70.1 | 55.7 | 63.9 | 91.4 | 70.3 |
| Georgia | 65.4 | 70.7 | 57.4 | 55.4 | 92.9 | 72.1 |
| Hawaii | 76.0 | 72.7 | 69.6 | 71.3 | 77.3 | 80.3 |
| Idaho | 80.1 | 81.7 | 78.2 | 68.7 | 91.5 | 65.8 |
| Illinois | 80.4 | 87.7 | 61.5 | 69.6 | 100.0 | 95.8 |
| Indiana | 74.1 | 75.9 | 52.6 | 66.6 | 100.0 | 69.8 |
| Iowa | 86.4 | 88.0 | 71.9 | 70.2 | 93.2 | 63.6 |
| Kansas | 79.1 | 82.4 | 64.7 | 62.2 | 93.4 | 63.9 |
| Kentucky | 74.4 | 74.2 | 67.8 | 75.6 | 100.0 | 51.0 |
| Louisiana | 63.5 | 71.9 | 53.3 | 72.3 | 86.1 | 65.2 |
| Maine 2 | 79.1 | ‡ | ‡ | ‡ | ‡ | ‡ |
| Maryland | 80.4 | 84.9 | 73.0 | 75.9 | 100.0 | 73.4 |
| Massachusetts | 81.5 | 84.4 | 69.6 | 64.7 | 89.1 | 66.8 |
| Michigan | 76.3 | 81.6 | 59.2 | 63.8 | 94.8 | 66.6 |
| Minnesota | 86.4 | 90.3 | 66.6 | 62.3 | 87.9 | 55.6 |
| Mississippi | 63.9 | 67.0 | 60.5 | 65.9 | 88.3 | 58.0 |
| Missouri | 82.4 | 85.2 | 68.0 | 83.6 | 100.0 | 93.2 |
| Montana | 82.0 | 84.7 | 64.6 | 69.5 | 100.0 | 63.3 |
| Nebraska | 83.8 | 88.6 | 57.0 | 67.2 | 97.8 | 55.1 |
| Nevada | 51.3 | — | — | — | — | — |
| New Hampshire | 83.4 | 83.3 | 100.0 | 48.1 | 99.2 | 60.0 |
| New Jersey | 84.6 | 88.3 | 72.9 | 76.4 | 100.0 | 100.0 |
| New Mexico | 66.8 | 74.7 | 71.4 | 62.3 | 100.0 | 61.0 |
| New York | 70.8 | 82.7 | 54.7 | 53.1 | 84.2 | 55.5 |
| North Carolina | 72.8 | 77.3 | 61.9 | 63.7 | 86.9 | 60.7 |
| North Dakota | 83.8 | 87.8 | 95.1 | 63.7 | 85.9 | 47.0 |
| Ohio | 79.0 | 84.4 | 55.5 | 65.6 | 95.3 | 74.1 |
| Oklahoma | 78.0 | 79.0 | 72.4 | 73.0 | 100.0 | 76.4 |
| Oregon | 76.7 | 77.1 | 65.8 | 71.0 | 91.2 | 62.8 |
| Pennsylvania | 82.7 | 86.9 | 64.5 | 67.8 | 100.0 | 63.8 |
| Rhode Island | 76.4 | 79.0 | 74.7 | 70.1 | 74.4 | 78.0 |
| South Carolina | — | — | — | — | — | — |
| South Dakota | 84.4 | 88.3 | 88.4 | 71.0 | 97.4 | 51.3 |
| Tennessee | 74.9 | 77.3 | 67.4 | 72.3 | 94.3 | 71.9 |
| Texas | 73.1 | 81.6 | 65.7 | 65.9 | 98.6 | 80.1 |
| Utah | 74.3 | 77.9 | 54.4 | 50.6 | 73.5 | 57.6 |
| Vermont | 89.3 | 81.1 | 91.2 | 100.0 | 81.8 | 83.9 |
| Virginia | 77.0 | 80.8 | 65.3 | 70.5 | 99.1 | 55.2 |
| Washington | 71.9 | 73.6 | 58.2 | 60.3 | 84.4 | 50.6 |
| West Virginia | 77.3 | 77.3 | 72.3 | 87.8 | 100.0 | 70.0 |
| Wisconsin | 89.6 | 94.0 | 63.1 | 75.0 | 97.5 | 73.9 |
| Wyoming | 76.0 | 78.5 | 61.8 | 65.5 | 98.5 | 38.5 |
| — Not available. State or jurisdiction did not report diploma count by race/ethnicity. Nevada did not report membership data needed to calculate the AFGR by race/ethnicity. | ||||||
| ‡ Reporting standards not met. | ||||||
| 1 Reporting states totals include any of the 50 states and the District of Columbia that reported all data elements. | ||||||
| 2 Maine included 1,161 diplomas that were awarded to students attending private schools that received a majority of their funding from public sources. These 1,161 diplomas were included in Maine and the reporting states counts but were not included in the AFGR calculations for the state and for the reporting states totals. Because the racial/ethnic breakdown of these students was not known, and because these students were not reported on Maine's state-level reporting in the past, the AFGR was not calculated by race/ethnicity, nor were Maine's data included among the reporting states for race/ethnicity. The diploma counts used to calculate the AFGR for Maine and for the reporting states were 13,189 and 2,964,125, respectively. |
NOTE: The Averaged Freshman Graduation Rate (AFGR) is an estimate of the percentage of an entering freshman class graduating in 4 years. For 2007–08, it equals the total number of diploma recipients in 2007–08 divided by the average membership of the 8th-grade class in 2003–04, the 9th-grade class in 2004–05, and the 10th-grade class in 2005–06. Ungraded students were allocated to individual grades proportional to each state's enrollment in those grades.
SOURCE: U.S. Department of Education, National Center for Education Statistics, Public School Graduates and Dropouts From the Common Core of Data: School Year 2007–08 (NCES 2010-341), tables 2 and 3. Data from "NCES Common Core of Data State Dropout and Completion Data File," School Year 2007–08, Version 1a.