

Percent difference in current expenditures minus federal revenues (other than Impact Aid) per pupil between high- and low-poverty districts 
The President's 2020 College Attainment Goal
25- to 34-year-olds who completed an associate's or higher degreeEarly Learning through High School
3- and 4-year-olds enrolled in preschool4th graders Proficient on the NAEP in reading4th graders Proficient on the NAEP in mathematics8th graders Proficient on the NAEP in reading8th graders Proficient on the NAEP in mathematicsFreshmen graduating from high school within 4 yearsPublic school graduates who took at least one Advanced Placement test in high schoolPostsecondary Education and Training
18- to 24-year-olds enrolled in colleges and universitiesStudents completing a bachelor's degree within 6 yearsStudents completing an associate's degree within 3 yearsBachelor's degrees conferred in science, technology, engineering, and mathematicsTeachers and Leaders
School districts using teacher evaluation systemsSchool districts using principal evaluation systemsPublic high school teachers with a major in their main assignment areaAn Excellent Education for All
Difference in current expenditures between high- and low-poverty districts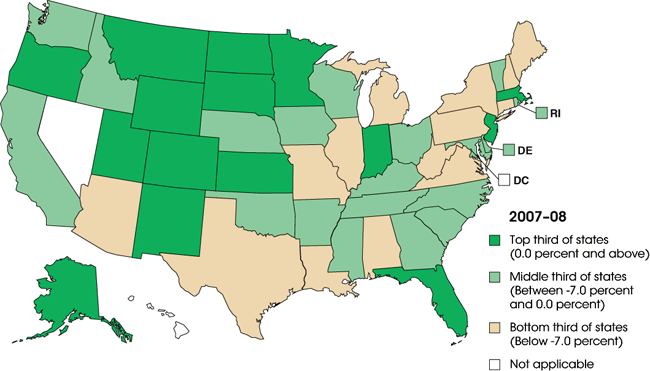
| 2007-08 | |||||||
|---|---|---|---|---|---|---|---|
| No adjustment for students in poverty | 40% weighted adjustment for students in poverty | ||||||
| State | Highest- poverty (quartile) districts | Lowest- poverty (quartile) districts | Percent difference between highest- and lowest- poverty districts1 | Highest- poverty (quartile) districts | Lowest- poverty (quartile) districts | Percent difference between highest- and lowest- poverty districts1 | |
| United States2 | † | † | † | † | † | † | |
| Alabama | $7,903 | $8,699 | -9.2 | $6,988 | $8,337 | -16.2 | |
| Alaska | $16,852 | $11,984 | 40.6 | $15,813 | $11,632 | 35.9 | |
| Arizona | $6,777 | $6,610 | 2.5 | $5,826 | $6,366 | -8.5 | |
| Arkansas | $7,498 | $7,099 | 5.6 | $6,633 | $6,712 | -1.2 | |
| California | $8,953 | $8,270 | 8.3 | $8,007 | $8,014 | -0.1 | |
| Colorado | $10,280 | $8,193 | 25.5 | $9,287 | $8,033 | 15.6 | |
| Connecticut | $13,494 | $13,658 | -1.2 | $12,177 | $13,506 | -9.8 | |
| Delaware | $11,438 | $10,976 | 4.2 | $10,286 | $10,441 | -1.5 | |
| District of Columbia 2 | † | † | † | † | † | † | |
| Florida | $8,582 | $8,219 | 4.4 | $7,862 | $7,781 | 1.0 | |
| Georgia | $9,080 | $8,800 | 3.2 | $8,032 | $8,484 | -5.3 | |
| Hawaii 2 | † | † | † | † | † | † | |
| Idaho | $6,328 | $6,522 | -3.0 | $5,851 | $6,277 | -6.8 | |
| Illinois | $8,401 | $9,914 | -15.3 | $7,467 | $9,733 | -23.3 | |
| Indiana | $8,911 | $7,683 | 16.0 | $7,913 | $7,489 | 5.7 | |
| Iowa | $8,099 | $7,839 | 3.3 | $7,508 | $7,671 | -2.1 | |
| Kansas | $9,312 | $8,627 | 7.9 | $8,534 | $8,467 | 0.8 | |
| Kentucky | $7,707 | $7,160 | 7.6 | $6,821 | $6,830 | -0.1 | |
| Louisiana | $7,918 | $8,467 | -6.5 | $6,787 | $7,925 | -14.4 | |
| Maine | $10,764 | $10,943 | -1.6 | $9,891 | $10,678 | -7.4 | |
| Maryland | $11,553 | $11,612 | -0.5 | $10,674 | $11,348 | -5.9 | |
| Massachusetts | $15,205 | $12,685 | 19.9 | $13,635 | $12,534 | 8.8 | |
| Michigan | $9,357 | $9,266 | 1.0 | $7,954 | $9,041 | -12.0 | |
| Minnesota | $10,000 | $8,414 | 18.8 | $9,212 | $8,285 | 11.2 | |
| Mississippi | $6,638 | $6,356 | 4.4 | $5,576 | $5,984 | -6.8 | |
| Missouri | $8,271 | $8,503 | -2.7 | $7,240 | $8,318 | -13.0 | |
| Montana | $9,796 | $8,184 | 19.7 | $8,783 | $7,867 | 11.6 | |
| Nebraska | $8,311 | $7,910 | 5.1 | $7,678 | $7,755 | -1.0 | |
| Nevada 2 | † | † | † | † | † | † | |
| New Hampshire | $10,637 | $11,701 | -9.1 | $10,075 | $11,547 | -12.7 | |
| New Jersey | $19,005 | $15,172 | 25.3 | $16,996 | $15,011 | 13.2 | |
| New Mexico | $8,693 | $7,515 | 15.7 | $7,623 | $7,030 | 8.4 | |
| New York | $15,273 | $17,296 | -11.7 | $13,125 | $16,998 | -22.8 | |
| North Carolina | $7,301 | $7,301 | # | $6,554 | $6,943 | -5.6 | |
| North Dakota | $8,840 | $7,558 | 17.0 | $8,076 | $7,347 | 9.9 | |
| Ohio | $9,772 | $9,233 | 5.8 | $8,473 | $9,028 | -6.2 | |
| Oklahoma | $6,665 | $6,273 | 6.3 | $5,952 | $6,056 | -1.7 | |
| Oregon | $8,439 | $7,842 | 7.6 | $7,695 | $7,539 | 2.1 | |
| Pennsylvania | $8,825 | $11,264 | -21.7 | $7,686 | $11,038 | -30.4 | |
| Rhode Island | $13,094 | $12,583 | 4.1 | $11,462 | $12,298 | -6.8 | |
| South Carolina | $8,078 | $7,858 | 2.8 | $7,243 | $7,467 | -3.0 | |
| South Dakota | $8,540 | $6,798 | 25.6 | $7,282 | $6,558 | 11.0 | |
| Tennessee | $6,936 | $6,877 | 0.9 | $6,197 | $6,557 | -5.5 | |
| Texas | $7,355 | $7,312 | 0.6 | $6,449 | $7,097 | -9.1 | |
| Utah | $5,699 | $4,909 | 16.1 | $5,342 | $4,779 | 11.8 | |
| Vermont | $13,260 | $12,787 | 3.7 | $12,300 | $12,540 | -1.9 | |
| Virginia | $9,128 | $11,391 | -19.9 | $8,310 | $11,150 | -25.5 | |
| Washington | $8,344 | $8,164 | 2.2 | $7,656 | $7,971 | -4.0 | |
| West Virginia | $8,522 | $8,806 | -3.2 | $7,725 | $8,347 | -7.5 | |
| Wisconsin | $10,236 | $9,805 | 4.4 | $9,266 | $9,640 | -3.9 | |
| Wyoming | $13,766 | $12,934 | 6.4 | $13,019 | $12,640 | 3.0 | |
| † Not applicable. | |||||||
| 1 Percent difference was calculated by dividing the difference between expenditures in the highest-poverty districts from that in lowest-poverty districts by the expenditures in lowest-poverty districts. A positive percentage indicates that the highest-poverty districts spent more money per pupil than the lowest-poverty districts. A negative percentage indicates that the highest-poverty districts spent less money per pupil than the lowest-poverty districts. | |||||||
| 2 Quartiles are not shown for states or jurisdictions where a single distict comprised 50 percent or more of the total state enrollment. | |||||||
NOTE: Current expenditures were used in order to exclude expenditures for capital outlay, which tend to have substantial changes from year to year. The current expenditures are for public elementary and secondary education only, and exclude expenditures for adult education, community services, and other programs that are not allocable to expenditures per student in public schools. Current expenditures have been adjusted by subtracting all federal education revenues other than impact aid, since Impact Aid is intended as a substitute for foregone local or state revenue. The federal revenues other than Impact Aid were subtracted from current expenditures to examine the distribution of funds provided through state and local education finance systems. High- and low-poverty districts represent the top and bottom quartiles, respectively. Quartiles were calculated based on ranking regular local education agencies by poverty rate, calculated as the percentage of children ages 5–17 in families living below the poverty level. Quartiles are pupil weighted, meaning that each quartile contains approximately the same number of children.
Based on an assumption that additional per-pupil spending is appropriate to meet the additional needs of students in poverty, the Dashboard indicator weights the number of poor students, defaulting to a factor of 40% (taken from the Department's Title I formula) when calculating per-pupil expenditures. Users may use alternative weights, including no additional weight, if they prefer.
U.S. Department of Education, Office of Planning, Evaluation, and Policy Development, Policy and Program Studies Service, unpublished tabulations based on U.S. Department of Commerce, Census Bureau, "Small Area Income and Poverty Estimates," 1997–98 and 2007–08; and U.S. Department of Education, National Center for Education Statistics (NCES), Common Core of Data (CCD), "Local Education Agency Universe Survey," 1997–98 and 2007–08.