

Percentage of bachelor's degrees conferred in science, technology, engineering, and mathematics fields 
The President's 2020 College Attainment Goal
25- to 34-year-olds who completed an associate's or higher degreeEarly Learning through High School
3- and 4-year-olds enrolled in preschool4th graders Proficient on the NAEP in reading4th graders Proficient on the NAEP in mathematics8th graders Proficient on the NAEP in reading8th graders Proficient on the NAEP in mathematicsFreshmen graduating from high school within 4 yearsPublic school graduates who took at least one Advanced Placement test in high schoolPostsecondary Education and Training
18- to 24-year-olds enrolled in colleges and universitiesStudents completing a bachelor's degree within 6 yearsStudents completing an associate's degree within 3 yearsBachelor's degrees conferred in science, technology, engineering, and mathematicsTeachers and Leaders
School districts using teacher evaluation systemsSchool districts using principal evaluation systemsPublic high school teachers with a major in their main assignment areaAn Excellent Education for All
Difference in current expenditures between high- and low-poverty districts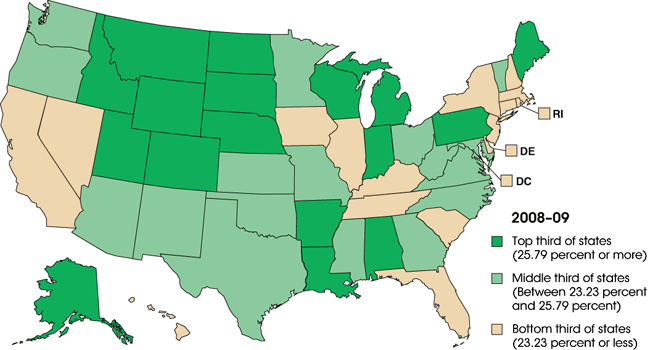
| Science, technology, engineering, and mathematics | ||||||||||
|---|---|---|---|---|---|---|---|---|---|---|
| Total | Agri- culture and natural resources |
Biology and bio- medical sciences | Computer and infor- mation sciences | Engineer- ing and engineer- ing technol- ogies |
Health profes- sions and clinical sciences | Mathe- matics and statistics | Physical sciences and science technol- ogies | |||
| Total bachelor's degrees | Number | Percent of all degrees | ||||||||
| United States | 1,601,368 | 386,824 | 24.2 | 24988 | 80756 | 37994 | 84636 | 120488 | 15496 | 22466 |
| Alabama | 24,245 | 6,367 | 26.3 | 368 | 1304 | 459 | 1510 | 2247 | 230 | 249 |
| Alaska | 1,626 | 484 | 29.8 | 37 | 89 | 38 | 99 | 151 | 19 | 51 |
| Arizona | 39,898 | 9,683 | 24.3 | 247 | 1379 | 2068 | 1386 | 4032 | 148 | 423 |
| Arkansas | 12,027 | 3,299 | 27.4 | 317 | 531 | 250 | 483 | 1461 | 76 | 181 |
| California | 160,930 | 37,077 | 23.0 | 2821 | 10502 | 3431 | 8547 | 7746 | 1895 | 2135 |
| Colorado | 28,833 | 7,548 | 26.2 | 570 | 1619 | 961 | 1905 | 1750 | 333 | 410 |
| Connecticut | 18,950 | 3,987 | 21.0 | 181 | 916 | 167 | 711 | 1471 | 289 | 252 |
| Delaware | 5,472 | 1,231 | 22.5 | 147 | 188 | 108 | 249 | 461 | 11 | 67 |
| District of Columbia | 10,957 | 1,940 | 17.7 | 13 | 346 | 629 | 221 | 548 | 72 | 111 |
| Florida | 80,275 | 18,250 | 22.7 | 943 | 3411 | 2153 | 3961 | 6776 | 310 | 696 |
| Georgia | 40,461 | 9,510 | 23.5 | 374 | 2085 | 1088 | 2145 | 2889 | 355 | 574 |
| Hawaii | 5,797 | 1,296 | 22.4 | 101 | 297 | 151 | 170 | 485 | 32 | 60 |
| Idaho | 9,066 | 2,458 | 27.1 | 328 | 428 | 204 | 431 | 892 | 62 | 113 |
| Illinois | 69,339 | 15,767 | 22.7 | 974 | 3017 | 2110 | 3198 | 4802 | 739 | 927 |
| Indiana | 39,583 | 10,371 | 26.2 | 424 | 1416 | 836 | 3079 | 3736 | 370 | 510 |
| Iowa | 26,239 | 5,339 | 20.3 | 543 | 1080 | 545 | 1136 | 1577 | 221 | 237 |
| Kansas | 17,521 | 4,429 | 25.3 | 443 | 721 | 366 | 1025 | 1555 | 102 | 217 |
| Kentucky | 19,996 | 4,526 | 22.6 | 458 | 856 | 240 | 904 | 1608 | 184 | 276 |
| Louisiana | 21,425 | 5,780 | 27.0 | 401 | 1323 | 340 | 1153 | 2186 | 117 | 260 |
| Maine | 6,909 | 2,155 | 31.2 | 264 | 449 | 59 | 375 | 816 | 61 | 131 |
| Maryland | 26,854 | 6,909 | 25.7 | 268 | 1643 | 1370 | 1175 | 1812 | 318 | 323 |
| Massachusetts | 50,106 | 11,640 | 23.2 | 450 | 2491 | 1035 | 2822 | 3261 | 705 | 876 |
| Michigan | 54,641 | 15,019 | 27.5 | 528 | 2613 | 1240 | 4689 | 4763 | 510 | 676 |
| Minnesota | 31,275 | 7,432 | 23.8 | 543 | 1905 | 864 | 1124 | 1977 | 362 | 657 |
| Mississippi | 12,430 | 3,020 | 24.3 | 211 | 698 | 148 | 570 | 1049 | 93 | 251 |
| Missouri | 38,370 | 9,588 | 25.0 | 647 | 1759 | 878 | 1837 | 3730 | 276 | 461 |
| Montana | 5,252 | 1,664 | 31.7 | 286 | 322 | 83 | 495 | 288 | 61 | 129 |
| Nebraska | 12,575 | 3,305 | 26.3 | 318 | 592 | 360 | 481 | 1312 | 87 | 155 |
| Nevada | 7,119 | 1,527 | 21.4 | 74 | 308 | 173 | 295 | 587 | 37 | 53 |
| New Hampshire | 8,879 | 1,717 | 19.3 | 188 | 314 | 157 | 350 | 506 | 83 | 119 |
| New Jersey | 34,625 | 7,366 | 21.3 | 241 | 2030 | 710 | 1595 | 1803 | 565 | 422 |
| New Mexico | 7,875 | 1,976 | 25.1 | 177 | 373 | 223 | 469 | 544 | 73 | 117 |
| New York | 120,999 | 25,802 | 21.3 | 1146 | 5084 | 2930 | 5320 | 8019 | 1483 | 1820 |
| North Carolina | 44,834 | 11,214 | 25.0 | 717 | 2541 | 841 | 2474 | 3302 | 441 | 898 |
| North Dakota | 5,604 | 1,822 | 32.5 | 162 | 238 | 138 | 405 | 792 | 38 | 49 |
| Ohio | 60,048 | 15,351 | 25.6 | 736 | 2812 | 1185 | 3372 | 6120 | 393 | 733 |
| Oklahoma | 19,634 | 4,856 | 24.7 | 448 | 989 | 271 | 1137 | 1640 | 140 | 231 |
| Oregon | 17,918 | 4,442 | 24.8 | 550 | 947 | 388 | 864 | 1224 | 190 | 279 |
| Pennsylvania | 84,692 | 22,583 | 26.7 | 913 | 3864 | 2567 | 5026 | 7676 | 983 | 1554 |
| Rhode Island | 10,291 | 2,012 | 19.6 | 159 | 467 | 205 | 443 | 513 | 136 | 89 |
| South Carolina | 21,058 | 4,805 | 22.8 | 252 | 1392 | 352 | 781 | 1448 | 196 | 384 |
| South Dakota | 5,031 | 1,943 | 38.6 | 273 | 240 | 149 | 401 | 765 | 45 | 70 |
| Tennessee | 29,388 | 6,752 | 23.0 | 520 | 1157 | 431 | 1347 | 2620 | 214 | 463 |
| Texas | 102,157 | 24,135 | 23.6 | 2472 | 5806 | 1349 | 5507 | 6856 | 1049 | 1096 |
| Utah | 21,504 | 5,546 | 25.8 | 229 | 1136 | 913 | 1109 | 1711 | 152 | 296 |
| Vermont | 5,788 | 1,351 | 23.3 | 308 | 278 | 148 | 197 | 266 | 83 | 71 |
| Virginia | 42,483 | 10,279 | 24.2 | 591 | 2165 | 971 | 2457 | 2911 | 401 | 783 |
| Washington | 30,091 | 7,013 | 23.3 | 459 | 1590 | 736 | 1531 | 1794 | 316 | 587 |
| West Virginia | 11,366 | 2,844 | 25.0 | 267 | 515 | 226 | 546 | 1069 | 48 | 173 |
| Wisconsin | 33,651 | 9,117 | 27.1 | 776 | 2326 | 642 | 1740 | 2789 | 320 | 524 |
| Wyoming | 1,765 | 597 | 33.8 | 86 | 127 | 7 | 171 | 152 | 21 | 33 |
SOURCE: U.S. Department of Education, National Center for Education Statistics, 2008–09 Integrated Postsecondary Education Data System, "Completions Survey" (IPEDS-C:99) and Fall 2009.