

Percentage of 18- to 24-year-olds enrolled in colleges and universities 
The President's 2020 College Attainment Goal
25- to 34-year-olds who completed an associate's or higher degreeEarly Learning through High School
3- and 4-year-olds enrolled in preschool4th graders Proficient on the NAEP in reading4th graders Proficient on the NAEP in mathematics8th graders Proficient on the NAEP in reading8th graders Proficient on the NAEP in mathematicsFreshmen graduating from high school within 4 yearsPublic school graduates who took at least one Advanced Placement test in high schoolPostsecondary Education and Training
18- to 24-year-olds enrolled in colleges and universitiesStudents completing a bachelor's degree within 6 yearsStudents completing an associate's degree within 3 yearsBachelor's degrees conferred in science, technology, engineering, and mathematicsTeachers and Leaders
School districts using teacher evaluation systemsSchool districts using principal evaluation systemsPublic high school teachers with a major in their main assignment areaAn Excellent Education for All
Difference in current expenditures between high- and low-poverty districts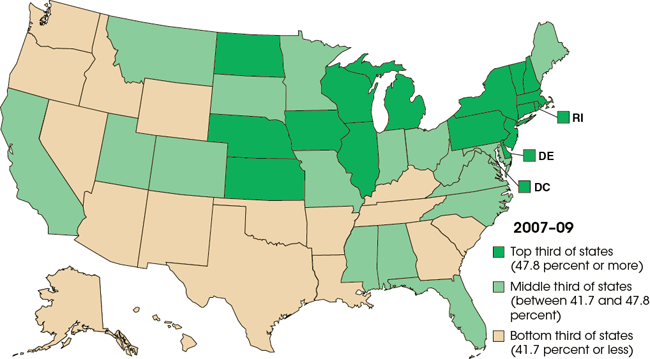
| State | Total | White | Black | Hispanic | Asian | Native Hawaiian/ Pacific Islander |
American Indian/ Alaska Native |
Two or more races |
|
|---|---|---|---|---|---|---|---|---|---|
| United States | 45.3 | 49.6 | 38.7 | 30.6 | 69.1 | 33.5 | 27.7 | 46.9 | |
| Alabama | 43.4 | 46.3 | 40.7 | 17.3 | 68.2 | ‡ | 45.3 | 39.8 | |
| Alaska | 29.3 | 33.6 | 25.1 | 30.8 | 26.6 | ‡ | 11.9 | 29.5 | |
| Arizona | 36.8 | 47.0 | 33.8 | 24.2 | 62.9 | ‡ | 22.6 | 45.5 | |
| Arkansas | 38.2 | 39.9 | 37.4 | 19.5 | 61.8 | ‡ | 16.8 | 39.2 | |
| California | 46.4 | 53.2 | 45.1 | 34.1 | 70.1 | 41.4 | 39.3 | 57.4 | |
| Colorado | 43.8 | 50.3 | 37.6 | 21.6 | 71.2 | ‡ | 31.0 | 53.8 | |
| Connecticut | 52.3 | 57.6 | 43.9 | 31.9 | 69.8 | ‡ | ‡ | 53.7 | |
| Delaware | 48.9 | 53.7 | 42.5 | 26.0 | 73.9 | ‡ | ‡ | 45.1 | |
| District of Columbia | 51.7 | 71.4 | 35.6 | 36.2 | 69.2 | ‡ | ‡ | 54.0 | |
| Florida | 43.0 | 46.4 | 39.3 | 36.6 | 66.9 | ‡ | 22.9 | 45.6 | |
| Georgia | 40.6 | 45.9 | 35.9 | 17.9 | 68.4 | ‡ | 26.3 | 45.5 | |
| Hawaii | 36.0 | 32.1 | 20.0 | 30.1 | 53.0 | 20.8 | ‡ | 35.5 | |
| Idaho | 38.7 | 41.3 | ‡ | 21.7 | 63.1 | ‡ | 20.0 | 39.0 | |
| Illinois | 48.9 | 54.8 | 36.8 | 31.5 | 74.2 | ‡ | 58.5 | 56.6 | |
| Indiana | 46.4 | 48.3 | 34.9 | 25.6 | 83.5 | ‡ | 49.3 | 44.4 | |
| Iowa | 50.0 | 51.1 | 41.1 | 29.7 | 70.8 | ‡ | ‡ | 39.8 | |
| Kansas | 47.9 | 51.0 | 40.2 | 24.0 | 70.2 | ‡ | 51.5 | 43.5 | |
| Kentucky | 40.7 | 41.7 | 36.4 | 20.0 | 71.9 | ‡ | ‡ | 33.4 | |
| Louisiana | 39.8 | 44.4 | 32.0 | 34.9 | 68.2 | ‡ | 24.7 | 51.4 | |
| Maine | 47.0 | 46.1 | 42.7 | 65.0 | 76.5 | ‡ | ‡ | 43.8 | |
| Maryland | 46.2 | 49.6 | 41.5 | 26.1 | 73.5 | ‡ | 21.2 | 45.0 | |
| Massachusetts | 55.9 | 58.4 | 48.4 | 37.4 | 69.2 | ‡ | ‡ | 53.3 | |
| Michigan | 51.1 | 53.9 | 39.2 | 30.5 | 74.8 | ‡ | 45.9 | 49.5 | |
| Minnesota | 47.0 | 49.5 | 33.8 | 22.1 | 53.0 | ‡ | 14.6 | 43.0 | |
| Mississippi | 44.0 | 49.7 | 38.9 | 16.7 | 57.4 | ‡ | ‡ | 36.0 | |
| Missouri | 44.0 | 45.8 | 35.6 | 23.7 | 69.0 | 35.8 | 42.5 | 44.4 | |
| Montana | 43.4 | 46.0 | ‡ | 30.1 | ‡ | ‡ | 17.6 | 48.7 | |
| Nebraska | 49.2 | 52.7 | 37.8 | 23.5 | 58.5 | ‡ | ‡ | 40.9 | |
| Nevada | 31.7 | 37.5 | 25.5 | 20.5 | 61.7 | 25.4 | 29.5 | 22.9 | |
| New Hampshire | 51.0 | 50.0 | 64.9 | 53.1 | 85.6 | ‡ | ‡ | 53.9 | |
| New Jersey | 49.3 | 56.4 | 40.5 | 31.1 | 66.7 | ‡ | ‡ | 49.1 | |
| New Mexico | 38.3 | 47.3 | 46.8 | 34.2 | 38.9 | ‡ | 28.9 | 41.8 | |
| New York | 52.2 | 57.2 | 44.8 | 37.1 | 70.3 | ‡ | 33.4 | 55.3 | |
| North Carolina | 42.4 | 45.9 | 40.3 | 16.9 | 64.7 | ‡ | 24.6 | 49.0 | |
| North Dakota | 50.2 | 53.6 | 32.2 | 30.0 | ‡ | ‡ | 12.9 | ‡ | |
| Ohio | 47.6 | 49.5 | 36.4 | 33.0 | 78.1 | ‡ | 27.6 | 47.6 | |
| Oklahoma | 40.7 | 44.1 | 40.5 | 23.9 | 65.6 | ‡ | 30.7 | 35.0 | |
| Oregon | 41.7 | 43.4 | 44.8 | 23.1 | 71.2 | 42.1 | 31.7 | 44.4 | |
| Pennsylvania | 50.5 | 52.7 | 40.4 | 29.1 | 78.7 | ‡ | 41.0 | 47.6 | |
| Rhode Island | 59.0 | 64.5 | 50.4 | 33.6 | 63.9 | ‡ | ‡ | 43.8 | |
| South Carolina | 40.7 | 45.7 | 34.2 | 19.6 | 68.8 | ‡ | 23.0 | 44.0 | |
| South Dakota | 42.1 | 46.4 | ‡ | 3.9 | ‡ | ‡ | 17.8 | 41.4 | |
| Tennessee | 39.7 | 41.7 | 36.6 | 14.1 | 63.4 | ‡ | ‡ | 47.2 | |
| Texas | 39.6 | 47.8 | 37.8 | 28.7 | 73.1 | 44.5 | 40.9 | 45.9 | |
| Utah | 46.1 | 48.6 | 30.4 | 23.9 | 67.9 | 36.6 | 42.8 | 59.3 | |
| Vermont | 51.6 | 51.8 | ‡ | ‡ | ‡ | ‡ | ‡ | ‡ | |
| Virginia | 45.1 | 48.8 | 36.4 | 27.6 | 66.3 | ‡ | 40.4 | 47.5 | |
| Washington | 38.9 | 40.7 | 33.1 | 22.1 | 62.6 | 21.5 | 17.6 | 39.6 | |
| West Virginia | 44.5 | 43.5 | 55.0 | 42.9 | 74.5 | ‡ | ‡ | 58.8 | |
| Wisconsin | 47.8 | 50.5 | 31.5 | 28.2 | 62.6 | ‡ | 26.6 | 34.9 | |
| Wyoming | 38.0 | 40.5 | ‡ | 25.1 | ‡ | ‡ | 12.0 | ‡ | |
| ‡ Reporting standards not met. | |||||||||
NOTE: Estimates excludes those who are enrolled in elementary and secondary schools. Estimates are 3-year averages of 2007–09 data. Use of a 3-year average increases the sample size, thereby reducing the size of sampling errors and producing more stable estimates.
SOURCE: U.S. Department of Commerce, Census Bureau, American Community Survey (ACS), 3-year Public Use Microdata Sample (PUMS) data, 2007–09.