

Percent of public school 4th graders Proficient on the NAEP in reading 
The President's 2020 College Attainment Goal
25- to 34-year-olds who completed an associate's or higher degreeEarly Learning through High School
3- and 4-year-olds enrolled in preschool4th graders Proficient on the NAEP in reading4th graders Proficient on the NAEP in mathematics8th graders Proficient on the NAEP in reading8th graders Proficient on the NAEP in mathematicsFreshmen graduating from high school within 4 yearsPublic school graduates who took at least one Advanced Placement test in high schoolPostsecondary Education and Training
18- to 24-year-olds enrolled in colleges and universitiesStudents completing a bachelor's degree within 6 yearsStudents completing an associate's degree within 3 yearsBachelor's degrees conferred in science, technology, engineering, and mathematicsTeachers and Leaders
School districts using teacher evaluation systemsSchool districts using principal evaluation systemsPublic high school teachers with a major in their main assignment areaAn Excellent Education for All
Difference in current expenditures between high- and low-poverty districts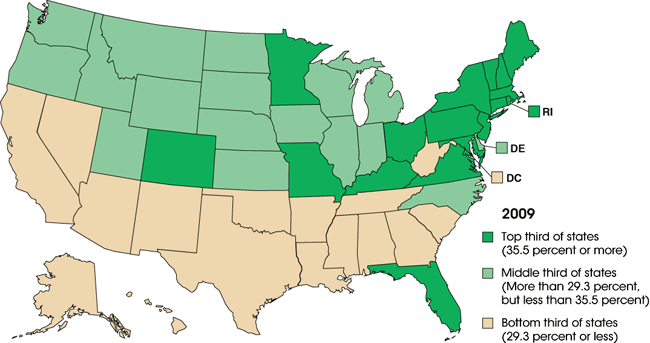
| At or above Basic | At or above Proficient | At Advanced | ||||||
|---|---|---|---|---|---|---|---|---|
| 2007 | 2009 | 2007 | 2009 | 2007 | 2009 | |||
| U.S. total | 66 | 66 | 32 | 32 | 7 | 7 | ||
| Alabama | 62 | 62 | 29 | 28 | 7 | 6 | ||
| Alaska | 62 | 59 | 29 | 27 | 6 | 5 | ||
| Arizona | 56 | 56 | 24 | 25 | 5 | 5 | ||
| Arkansas | 64 | 63 | 29 | 29 | 5 | 6 | ||
| California | 53 | 54 | 23 | 24 | 5 | 5 | ||
| Colorado | 70 | 72 | 36 | 40 | 9 | 11 | ||
| Connecticut | 73 | 76 | 41 | 42 | 12 | 11 | ||
| Delaware | 73 | 73 | 34 | 35 | 7 | 7 | ||
| District of Columbia | 39 | 44 | 14 | 17 | 4 | 5 | ||
| Florida | 70 | 73 | 34 | 36 | 8 | 8 | ||
| Georgia | 66 | 63 | 28 | 29 | 5 | 6 | ||
| Hawaii | 59 | 57 | 26 | 26 | 5 | 6 | ||
| Idaho | 70 | 69 | 35 | 32 | 8 | 6 | ||
| Illinois | 65 | 65 | 32 | 32 | 8 | 9 | ||
| Indiana | 68 | 70 | 33 | 34 | 7 | 7 | ||
| Iowa | 74 | 69 | 36 | 34 | 7 | 7 | ||
| Kansas | 72 | 72 | 36 | 35 | 8 | 7 | ||
| Kentucky | 68 | 72 | 33 | 36 | 8 | 8 | ||
| Louisiana | 52 | 51 | 20 | 18 | 3 | 2 | ||
| Maine | 73 | 70 | 36 | 35 | 7 | 8 | ||
| Maryland | 69 | 70 | 36 | 37 | 10 | 11 | ||
| Massachusetts | 81 | 80 | 49 | 47 | 16 | 13 | ||
| Michigan | 66 | 64 | 32 | 30 | 8 | 6 | ||
| Minnesota | 73 | 70 | 37 | 37 | 9 | 9 | ||
| Mississippi | 51 | 55 | 19 | 22 | 3 | 4 | ||
| Missouri | 67 | 70 | 32 | 36 | 7 | 8 | ||
| Montana | 75 | 73 | 39 | 35 | 8 | 7 | ||
| Nebraska | 71 | 70 | 35 | 35 | 8 | 8 | ||
| Nevada | 57 | 57 | 24 | 24 | 5 | 4 | ||
| New Hampshire | 76 | 77 | 41 | 41 | 11 | 9 | ||
| New Jersey | 77 | 76 | 43 | 40 | 12 | 10 | ||
| New Mexico | 58 | 52 | 24 | 20 | 5 | 4 | ||
| New York | 69 | 71 | 36 | 36 | 10 | 9 | ||
| North Carolina | 64 | 65 | 29 | 32 | 6 | 7 | ||
| North Dakota | 75 | 76 | 35 | 35 | 6 | 6 | ||
| Ohio | 73 | 71 | 36 | 36 | 8 | 9 | ||
| Oklahoma | 65 | 65 | 27 | 28 | 4 | 4 | ||
| Oregon | 62 | 65 | 28 | 31 | 6 | 7 | ||
| Pennsylvania | 73 | 70 | 40 | 37 | 11 | 10 | ||
| Rhode Island | 65 | 69 | 31 | 36 | 7 | 9 | ||
| South Carolina | 59 | 62 | 26 | 28 | 5 | 6 | ||
| South Dakota | 71 | 70 | 34 | 33 | 7 | 7 | ||
| Tennessee | 61 | 63 | 27 | 28 | 6 | 6 | ||
| Texas | 66 | 65 | 30 | 28 | 6 | 6 | ||
| Utah | 69 | 67 | 34 | 31 | 8 | 6 | ||
| Vermont | 74 | 75 | 41 | 41 | 11 | 12 | ||
| Virginia | 74 | 74 | 38 | 38 | 9 | 9 | ||
| Washington | 70 | 68 | 36 | 33 | 10 | 8 | ||
| West Virginia | 63 | 62 | 28 | 26 | 5 | 4 | ||
| Wisconsin | 70 | 67 | 36 | 33 | 8 | 7 | ||
| Wyoming | 73 | 72 | 36 | 33 | 8 | 5 | ||
NOTE: Some apparent differences between estimates may not be statistically significant. Achievement levels define what students should know and be able to do: Basic indicates partial mastery of fundamental skills, Proficient indicates demonstrated competency over challenging subject matter, and Advanced indicates superior performance. The percentage of students at or above Proficient includes students at the Proficient and the Advanced achievement levels. Similarly, the percentage of students at or above Basic includes students at the Basic, Proficient, and Advanced achievement levels.
SOURCE: U.S. Department of Education, Institute of Education Sciences, National Center for Education Statistics, National Assessment of Educational Progress (NAEP), 2007 and 2009 Reading Assessments, retrieved July 8, 2010, from the NAEP Data Explorer http://nces.ed.gov/nationsreportcard/naepdata/.